Windows: How to debug the Dump file by using WinDbg
I have collected this document which helps us to analyses
the kernel dump and various dump occur in windows server.
List of Windows Tools used to analysis the OS•
WinDbg, KD, CDB, and NTSD Debuggers
Debugging Tools and Symbols•
About WinDbg
• To Prepare for a Debugging Session
• About the Microsoft Symbol Server
• To use the Microsoft Symbol Server
• Symbols and Symbol Files
• Windows Symbols
• To Prepare for a Debugging Session
• About the Microsoft Symbol Server
• To use the Microsoft Symbol Server
• Symbols and Symbol Files
• Windows Symbols
Kernel-Mode Dump Files•
Varieties of Kernel-Mode Dump Files− Complete Memory Dump
− Kernel Memory Dump
− Small Memory Dump
• Creating a Kernel-Mode Dump File
• Enabling a Kernel-Mode Dump File
− Kernel Memory Dump
− Small Memory Dump
• Creating a Kernel-Mode Dump File
• Enabling a Kernel-Mode Dump File
Forcing a System Crash•
Debugging a Stalled System
• Forcing a System Crash from the Debugger
• Forcing a System Crash from the Keyboard
• Creating a Dump File without a System Crash
• Verifying the Creation of a Kernel-Mode Dump File
• Analyzing a Kernel-Mode Dump File with WinDbg• Analyzing the Dump File
• Examples of Dump file Analyzing
• Forcing a System Crash from the Debugger
• Forcing a System Crash from the Keyboard
• Creating a Dump File without a System Crash
• Verifying the Creation of a Kernel-Mode Dump File
• Analyzing a Kernel-Mode Dump File with WinDbg• Analyzing the Dump File
• Examples of Dump file Analyzing
List of Windows Tools
used to analysis the OSDebugging Tools for Windows includes the following
debuggers.
• WinDbg (Windbg.exe)
A user-mode and kernel-mode debugger with a graphical interface.
• KD (Kd.exe)
A kernel-mode debugger with a console interface.
• CDB (Cdb.exe)
A user-mode debugger with a console interface.
• NTSD (Ntsd.exe)
A user-mode debugger with a console interface. CDB and NTSD are virtually identical. In this documentation, whenever a reference is made to "CDB", it applies to both CDB and NTSD.
Additional Tools and Utilities•
Logger (Logger.exe and Logexts.dll)
A tool and an extension DLL that record the function calls and other actions of a program.
• LogViewer (Logviewer.exe)
A tool that displays the logs created by Logger.
• SymSrv (Symsrv.dll)
A symbol server that the debugger can use to connect to a symbol store.
• SymStore (Symstore.exe)
A tool used to create a symbol store.
• DumpChk (Dump File Checking Utility, Dumpchk.exe)
A tool used to validate a memory dump file.
• DbgSrv (Dbgsrv.exe)
A process server used for remote debugging.
• The Kill tool (Kill.exe)
A tool used to terminate a process.
• TList (Task List Viewer, Tlist.exe)
A tool used to list all running processes.
Documentation
"Debugging Tools for Windows" (Debugger.chm)
This is the documentation you are currently reading. It is the central documentation for Debugging Tools for Windows.
"Debug Help Library" (Dbghelp.chm)
This documentation describes the DbgHelp API and the ImageHlp API, and also explains how to create your own symbol server. This is installed when you peform a custom install of Debugging Tools for Windows and select the SDK feature and its subfeatures.• WinDbg, KD, CDB, and NTSD Debuggers
These Microsoft debuggers are fully capable of running on computers with x86-based, Itanium, or x64-based processors. The debuggers can debug the Windows operating system, applications, services, and drivers that run on the operating system. The following operating systems are supported:
Windows 7
Windows Server 2008
Windows Vista
Windows Server 2003
Windows XP
Windows 2000
The CDB and NTSD debuggers are virtually identical. In this documentation set, references to "CDB" refer to both CDB and NTSD. Any differences between the two debuggers are stated explicitly
A copy of NTSD resides in the System32 directory of Windows prior to Windows Vista. This documentation describes the version of NTSD in the Debugging Tools for Windows package—it might not match the version of NTSD in the System32 directory.
32-Bit and 64-Bit PackagesThere are three versions of the debugger package: a 32-bit version for x86-based and x64-based binaries, a 64-bit version for Itanium-based binaries, and a 64-bit version for x64-based binaries. Since debugging typically involves multiple applications, or multiple operating systems, selecting a debugger package is not as straightforward as it is with other applications.
Debugging Tools and SymbolsDebugging Tools for Windows is a set of extensible tools for
debugging device drivers for the Microsoft Windows family of operating systems.
Debugging Tools for Windows supports debugging of:
Applications, services, drivers, and the Windows kernel.
Native 32-bit x86, native Intel Itanium, and native x64 platforms.
Microsoft Windows NT 4.0, Windows 2000, Windows XP, Microsoft Windows Server 2003, Windows Vista and Windows Server 2008.
User-mode programs and kernel-mode programs.
Live targets and dump files.
Local and remote targets.
In addition to Debugging Tools for Windows, effective debugging also requires:
Special debugging routines, macros, and global variables in the Windows Driver Development Kit (DDK). You can use these routines in your driver code to send messages to a debugger and set breakpoints to aid in debugging.
Access to Windows symbol files. If you have access to the Internet while debugging, you can set your debugger's symbol path to point to the Windows symbol server. If you do not have access to the Internet while debugging, you can download symbols in advance from the Microsoft website.
Debugging Tools for Windows includes WinDbg, a powerful debugger with a graphical interface and a console interface, as well as the console-based debuggers NTSD, CDB, and KD.
About WinDbgWinDbg provides source-level debugging through a graphical
user interface and a text-based interface.
WinDbg uses the Microsoft Visual Studio debug symbol formats for source-level debugging. It can access any public function's names and variables exposed by modules that were compiled with Codeview (.pdb) symbol files.
WinDbg can view source code, set breakpoints, view variables (including C++ objects), stack traces, and memory. It includes a command window to issue a wide variety of commands not available through the drop-down menus. For kernel-mode debugging, WinDbg typically requires two computers (the host machine and the target machine). It also allows you to remotely debug user-mode code.
To Prepare for a Debugging Session1. If you want to debug kernel-mode code, set up a host computer to run the debugger and a target computer to run the code being debugged. Connect the two computers using either an IEEE 1394 cable or a null-modem cable between two serial ports.
2. Download and install the latest version of Debugging Tools for Windows on the host computer. The tools can also be installed from the Windows DDK, the Platform SDK, or the Customer Support Diagnostics CD.
3. Use Windows Symbol Server to access the symbol files from the host computer.
WinDbg provides source-level debugging through a graphical user interface and a text-based interface.
WinDbg uses the Microsoft Visual Studio debug symbol formats for source-level debugging. It can access any public function's names and variables exposed by modules that were compiled with Codeview (.pdb) symbol files.
WinDbg can view source code, set breakpoints, view variables (including C++ objects), stack traces, and memory. It includes a command window to issue a wide variety of commands not available through the drop-down menus. For kernel-mode debugging, WinDbg typically requires two computers (the host machine and the target machine). It also allows you to remotely debug user-mode code.
To Prepare for a Debugging Session1. If you want to debug kernel-mode code, set up a host computer to run the debugger and a target computer to run the code being debugged. Connect the two computers using either an IEEE 1394 cable or a null-modem cable between two serial ports.
2. Download and install the latest version of Debugging Tools for Windows on the host computer. The tools can also be installed from the Windows DDK, the Platform SDK, or the Customer Support Diagnostics CD.
3. Use Windows Symbol Server to access the symbol files from the host computer.
WinDbg provides source-level debugging through a graphical user interface and a text-based interface.
WinDbg uses the Microsoft Visual Studio debug symbol formats for source-level debugging. It can access any public function's names and variables exposed by modules that were compiled with Codeview (.pdb) symbol files.
WinDbg can view source code, set breakpoints, view variables (including C++ objects), stack traces, and memory. It includes a command window to issue a wide variety of commands not available through the drop-down menus. For kernel-mode debugging, WinDbg typically requires two computers (the host machine and the target machine). It also allows you to remotely debug user-mode code.
About the Microsoft Symbol Server•
Symbol server technology is built into Debugging
Tools for Windows. Microsoft provides access to an Internet symbol server that
contains symbol files for the Microsoft Windows Server 2003, Windows XP, and
Windows 2000 operating systems, as well as other Microsoft products.
• The Internet symbol server is populated with a variety of Windows symbols for Microsoft Windows operating systems, including hot fixes, Service Packs, Security Rollup Packages, and retail releases. Symbols are also available on the server for current Betas and Release Candidates for Windows products, plus a variety of other Microsoft products, such as Microsoft Internet Explorer.
• If you have access to the Internet during debugging, you can configure the debugger to download symbols as needed during a debugging session, rather than downloading symbol files separately before a debugging session. The symbols are downloaded to a directory location that you specify and then the debugger loads them from there.
To use the Microsoft Symbol Server1. Make sure you have
installed the latest version of Debugging Tools for Windows.
2. Start a debugging session.
3. Decide where to store the downloaded symbols (the "downstream store"). This can be a local drive or a UNC path.
4. Set the debugger symbol path as follows, substituting your downstream store path for DownstreamStore.
SRV*DownstreamStore*http://msdl.microsoft.com/download/symbolsFor example, to download symbols to c:\websymbols, you would add the following to your symbol path:SRV*c:\websymbols*http://msdl.microsoft.com/download/symbolsNote: http://msdl.microsoft.com/download/symbols is not browsable and is intended only for access by the debugger. For more information on setting symbol paths and using symbol servers, see the documentation accompanying Debugging Tools for Windows
Windows Symbols•
Microsoft Windows 2000 keeps its symbols in
files with the extensions .pdb and .dbg. Windows XP and
later versions of Windows use .pdb files exclusively. Windows drivers
can follow either model.
• The compiler and the linker control the symbol format. The Visual C++ 5.0 Linker creates both .pdb and .dbg symbol files — the .dbg files it creates are essentially pointers to the .pdb files. The Visual C++ 6.0 Linker, as well as the linkers of later versions of Visual Studio, places all symbols into .pdb files.
• The Windows operating system is built in two versions. The free build (or retail build) has relatively small binaries, and the checked build (or debug build) has larger binaries, with more debugging symbols in the code itself. Each of these builds has its own symbol files. When debugging a target on Windows, you must use the symbol files that match the build of Windows on the target.
The following table lists several of the directories which exist in a standard Windows symbol tree:
Directory Contains Symbol Files for
ACM Microsoft Audio Compression Manager files
COM Executable files (.com)
CPL Control Panel programs
DLL Dynamic-link library files (.dll)
DRV Driver files (.drv)
EXE Executable files (.exe)
SCR Screen-saver files
SYS Driver files (.sys)
Kernel-Mode Dump FilesWhen a kernel-mode error occurs, the default behavior of
Microsoft Windows is to display the blue screen with bug check data.
However, there are several alternative behaviors that can be selected:
• A kernel debugger (such as WinDbg or KD) can be contacted.
• A memory dump file can be written.
• The system can automatically reboot.
A memory dump file can be written, and the system can automatically reboot afterwards.
This section covers how to create and analyze a kernel-mode memory dump file. There are three different varieties of crash dump files. However, it should be remembered that no dump file can ever be as useful and versatile as a live kernel debugger attached to the system that has failed.
Varieties of Kernel-Mode Dump FilesThere are three kinds of kernel-mode crash dump files:
• Complete Memory Dump
A Complete Memory Dump is the largest kernel-mode dump file. This file contains all the physical memory for the machine at the time of the fault.
This dump file requires a pagefile on your boot drive that is at least as large as your main system memory; it should be able to hold a file whose size equals your entire RAM plus one megabyte.
The Complete Memory Dump file is written to %SystemRoot%\Memory.dmp by default.
If a second bug check occurs and another Complete Memory Dump (or Kernel Memory Dump) is created, the previous file will be overwritten.
• Kernel Memory Dump
A Kernel Memory Dump contains all the memory in use by the kernel at the time of the crash.
This kind of dump file is significantly smaller than the Complete Memory Dump. Typically, the dump file will be around one-third the size of the physical memory on the system. Of course, this quantity will vary considerably, depending on your circumstances.
This dump file will not include unallocated memory, or any memory allocated to user-mode applications. It only includes memory allocated to the Windows kernel and hardware abstraction level (HAL), as well as memory allocated to kernel-mode drivers and other kernel-mode programs.
For most purposes, this crash dump is the most useful. It is significantly smaller than the Complete Memory Dump, but it only omits those portions of memory that are unlikely to have been involved in the crash.
Since this kind of dump file does not contain images of any user-mode executables residing in memory at the time of the crash, you may also need to set the executable image path if these executables turn out to be important.
The Kernel Memory Dump file is written to %SystemRoot%\Memory.dmp by default.
If a second bug check occurs and another Kernel Memory Dump (or Complete Memory Dump) is created, the previous file will be overwritten.
Small Memory Dump
• A Small Memory Dump is much smaller than the other two kinds of kernel-mode crash dump files. It is exactly 64 KB in size, and requires only 64 KB of pagefile space on the boot drive.
• This dump file includes the following:
• The bug check message and parameters, as well as other blue-screen data.
• The processor context (PRCB) for the processor that crashed.
• The process information and kernel context (EPROCESS) for the process that crashed.
• The thread information and kernel context (ETHREAD) for the thread that crashed.
• The kernel-mode call stack for the thread that crashed. If this is longer than 16 KB, only the topmost 16 KB will be included.
• A list of loaded drivers.
• In Windows XP and later versions of Windows, the following items are also included:
• A list of loaded modules and unloaded modules.
• The debugger data block. This contains basic debugging information about the system.
• Any additional memory pages that Windows identifies as being useful in debugging failures. This includes the data pages that the registers were pointing to when the crash occurred, and other pages specifically requested by the faulting component.
• (Intel Itanium processor only) The backing store.
• (Windows Server 2003 and later) The Windows SKU — for example, "Professional" or "Server".
• This kind of dump file can be useful when space is greatly limited. However, due to the limited amount of information included, errors that were not directly caused by the thread executing at time of crash may not be discovered by an analysis of this file.
• Since this kind of dump file does not contain images of any executables residing in memory at the time of the crash, you may also need to set the executable image path if these executables turn out to be important.
• If a second bug check occurs and a second Small Memory Dump file is created, the previous file will be preserved. Each additional file will be given a distinct name, which contains the date of the crash encoded in the filename. For example, mini022900-01.dmp is the first memory dump file generated on February 29, 2000. A list of all Small Memory Dump files is kept in the directory %SystemRoot%\Minidump.
• The difference between these dump files is one of size. The Complete Memory Dump is the largest and contains the most information, the Kernel Memory Dump is somewhat smaller, and the Small Memory Dump is only 64 KB in size.
• The advantage to the larger files is that, since they contain more information, they are more likely to help you find the cause of the crash.
• The advantage of the smaller files is that they are smaller and written more quickly. Speed is often valuable; if you are running a server, you may want the server to reboot as quickly as possible after a crash, and the reboot will not take place until the dump file has been written.
• After a Complete Memory Dump or Kernel Memory Dump has been created, it is possible to create a Small Memory Dump file from the larger dump file. See the .dump (Create Dump File) command for details.
• Note Much information can be obtained by analyzing a kernel-mode dump file. However, no kernel-mode dump file can provide as much information as actually debugging the crash directly with a kernel debugger.
Creating a Kernel-Mode Dump File•
There are three ways in which a kernel-mode dump
file can be created:
• You can enable the dump file from the Control Panel, and then the system can crash on its own.
• You can enable the dump file from the Control Panel, and then force the system to crash.
• You can use the debugger to create a dump file without crashing the system.
This section includes:
Enabling a Kernel-Mode Dump File• During a system crash, the Windows crash dump settings determine whether a dump file will be created, and if so, what size the dump file will be.
• The Windows Control Panel controls the kernel-mode crash dump settings. Only a system administrator can modify these settings.
• To change these settings, go to Control Panel and click on the System icon. Select the Advanced panel. In Windows 2000, click on Startup and Recovery. In Windows XP and later versions of Windows, click on the Settings button in the Startup and Recovery section.
• You will see the following dialog box:
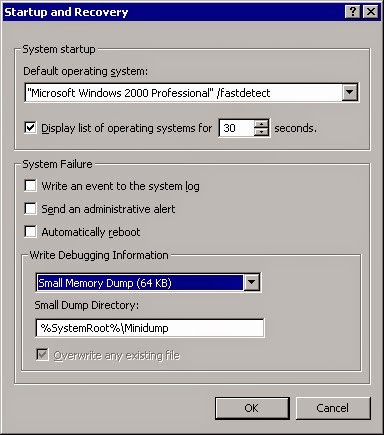
Control Panel: Startup and Recovery Dialog Box
Under Write Debugging Information, you can select which of the three sizes of dump files you wish to have as the default. Only one dump file can be created for any given crash. The default crash dump size is Small Memory Dump.
After selecting the dump file size, you can accept or change the default dump file path and file name.
You can also select or deselect any of the Write an event to the system log, Send an administrative alert, and Automatically reboot options.
If you make any changes, the system will reboot after you click OK.
The settings that you select will apply to any kernel-mode dump file created by a system crash, regardless of whether the system crash was accidental or whether it was caused by the debugger.
However, these settings do not affect dump files created by the .dump command.
• Once kernel-mode dump files have been enabled, most system crashes should cause a crash file to be written and the blue screen to be displayed.
• However, there are times that a system freezes without actually initiating a kernel crash. Possible symptoms of such a freeze include:
• The mouse pointer moves, but can't do anything.
• All video is frozen, the mouse pointer does not move, but paging continues.
• There is no response at all to the mouse or keyboard, and no use of the disk.
• If an experienced debugging technician is present, he or she can hook up a kernel debugger and analyze the problem.
Forcing a System Crash from the Debugger
• If KD or WinDbg is performing kernel-mode debugging, it can force a system crash to occur. This is done by entering the .crash (Force System Crash) command at the command prompt. (If the target computer does not crash immediately, follow this with the g (Go) command.)
• When this command is issued, the system will call KeBugCheck and issue bug check 0xE2 (MANUALLY_INITIATED_CRASH). Unless crash dumps have been disabled, a crash dump file is written at this point.
• After the crash dump file has been written, the kernel debugger on the host computer will be alerted and can be used to actively debug the crashed target.
Forcing a System Crash from the Keyboard
• Most of the following keyboards can cause a system crash directly:
• PS/2 keyboards connected on i8042prt ports• This feature is available in Windows 2000 and later versions of Windows operating system.
• USB keyboards• This feature is available in:
• Windows Server 2003 Service Pack 1 if the hotfix available with KB 244139 is installed.
• Windows Server 2003 (with Service Pack 2 or later).
• Windows 7 and later versions of Windows operating system.
• You must ensure the following three settings before the keyboard can cause a system crash:
• If you wish a crash dump file to be written, you must enable such dump files, choose the path and file name, and select the size of the dump file.
• With PS/2 keyboards, you must enable the keyboard-initiated crash in the registry. In the registry key HKEY_LOCAL_MACHINE\System\CurrentControlSet\Services\i8042prt\Parameters, create a value named CrashOnCtrlScroll, and set it equal to a REG_DWORD value of 0x01.
• With USB keyboards, you must enable the keyboard-initiated crash in the registry. In the registry key HKEY_LOCAL_MACHINE\System\CurrentControlSet\Services\kbdhid\Parameters, create a value named CrashOnCtrlScroll, and set it equal to a REG_DWORD value of 0x01.
• You must restart the system for these settings to take effect.
• After this is completed, the keyboard crash can be initiated by using the following hotkey sequence: Hold down the rightmost CTRL key, and press the SCROLL LOCK key twice.
• The system then calls KeBugCheck and issues bug check 0xE2 (MANUALLY_INITIATED_CRASH). Unless crash dumps have been disabled, a crash dump file is written at this point.
• If a kernel debugger is attached to the crashed machine, the machine will break into the kernel debugger after the crash dump file has been written.
Creating a Dump File Without a System Crash• If KD or WinDbg is performing kernel-mode debugging, it can cause a kernel-mode dump file to be written without crashing the target computer.
• This dump file can be either a Complete Memory Dump or a Small Memory Dump. The Control Panel settings are not relevant to this action.
• Whereas dump files caused by a system crash are written to the computer that has crashed, this dump file will be written to the host computer.
• For details, see the .dump (Create Dump File) command.
• .dump (Create Dump File)• The .dump command creates a user-mode or kernel-mode crash dump file.
• Syntax• .dump Options FileName
.dump /?
• Parameters• Options• Represents one or more of the following options
• /o• Overwrites an existing dump file with the same name. If this option is not used and there is a file with the same file name, the dump file is not written.
• /f• (Kernel mode:) Creates a complete memory dump.
• (User mode:) Creates a full user-mode dump. Despite their names, the largest minidump file actually contains more information than a full user-mode dump. For example, .dump /mf or .dump /ma creates a larger and more complete file than .dump /f. In user mode, .dump /m[MiniOptions] is always preferable to .dump /f.
• /m[MiniOptions]
• Creates a small memory dump (in kernel mode) or a minidump (in user mode). If neither /f nor /m is specified, /m is the default.
• In user mode, /m can be followed with additional MiniOptions specifying extra data that is to be included in the dump. If no MiniOptions are included, the dump will include module, thread, and stack information, but no additional data. You can add any of the following MiniOptions to change the contents of the dump file; they are case-sensitive.
• Verifying the Creation of a Kernel-Mode Dump File• If you have a machine that has broken into the debugger, but you are unsure whether the crash dump file was successfully written, execute the following command:
• dd nt!IopFinalCrashDumpStatus L1
• This displays the value of the IopFinalCrashDumpStatus variable.
• If this value equals zero, the process was successful. If it equals -1 (0xFFFFFFFF), the dump process has not started.
• Any other value is a status code indicating an error during the dump process.
Analyzing a Kernel-Mode Dump File with WinDbg
• Kernel-mode memory dump files can be analyzed by WinDbg. The processor or Windows version that the dump file was created on does not need to match the platform on which KD is being run.
• Starting WinDbg• To analyze a dump file, start WinDbg with the -z command-line option:
• windbg -y SymbolPath -i ImagePath -z DumpFileName
• The -v option (verbose mode) is also useful. For a full list of options, see WinDbg Command-Line Options.
• If WinDbg is already running and is in dormant mode, you can open a crash dump by selecting the File | Open Crash Dump menu command or pressing the CTRL+D shortcut key. When the Open Crash Dump dialog box appears, enter the full path and name of the crash dump file in the File name text box, or use the dialog box to select the proper path and file name. When the proper file has been chosen, click Open.
• You can also open a dump file after the debugger is running by using the .opendump (Open Dump File) command, followed with g (Go).
• It is possible to debug multiple dump files at the same time. This can be done by including multiple -z switches on the command line (each followed by a different file name), or by using .opendump to add additional dump files as debugger targets. For information about how to control a multiple-target session, see Debugging Multiple Targets.
• Dump files generally end with the extension .dmp or .mdmp. You can use network shares or Universal Naming Convention (UNC) file names for the memory dump file.
• It is also common for dump files to be packed into a CAB file. If you specify the file name (including the .cab extension) after the -z option or as the argument to an .opendump command, the debugger can read the dump files directly out of the CAB. However, if there are multiple dump files stored in a single CAB, the debugger will only be able to read one of them. The debugger will not read any additional files from the CAB, even if they were symbol files or other files associated with the dump file.
Analyzing the Dump File•
If you are analyzing a Kernel Memory Dump or a
Small Memory Dump, you may need to set the executable image path to point to
any executable files that may have been loaded in memory at the time of the
crash. See Executable
Image Path for details.
• Analysis of a dump file is similar to analysis of a live debugging session. See the Debugger Commands reference section for details on which commands are available for debugging dump files in kernel mode.
• In most cases, you should begin by using !analyze. This extension command performs automatic analysis of the dump file and can often result in a lot of useful information.
• The .bugcheck (Display Bug Check Data) shows the bug check code and its parameters. Look up this bug check in the Bug Check Codes section of the Windows Driver Kit (WDK) documentation for information about the specific error.
• The following debugger extensions are especially useful for analyzing a kernel-mode crash dump:
!drivers!kdext*.locks!memusage!vm!errlog!process 0 0!process 0 7

Comments
Post a Comment